When we crossed $1m in monthly recurring revenue (MRR) ConvertKit’s open metrics dashboard received a wave of attention. That attention brings good questions, but also confusion and people reading the metrics only on the surface level. In this article I’ll break down what I look for in the metrics and how you can go beyond only caring about MRR.
Let’s start with MRR
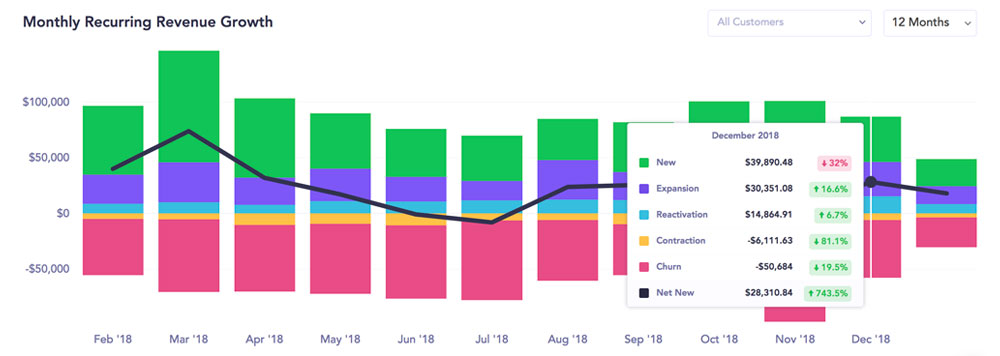
When everyone looks at Baremetrics they immediately look at the MRR—as they should. It’s the most important metric in the business. But what most novices miss is that MRR growth is actually the summary of five metrics: new, expansion, reactivation, contraction, and churn. So the most interesting graph isn’t total MRR, but instead the breakout further down the page.
This shows the monthly break out for how we are growing over time. The black line in the middle is the trend. As you can see it’s all over the map. From as high as $73,000 net new in March to a couple negative months in the summer. The more predictable a company’s growth, the more even the black line we’ll be.
I also often look at the daily breakout to see the change on a given day, but that’s more in the weeds and I’d never look at that to evaluate another company. Monthly is as granular as you need to go.
The difference between MRR and net revenue
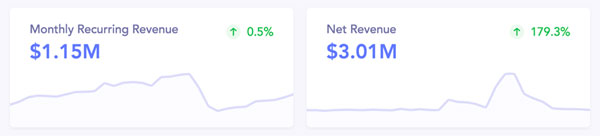
Right at the top of the dashboard you see both MRR and net revenue for the month. They are often nearly identical, so why track both?
Good question! Despite often being very similar numbers, they tell us different things:
- MRR is the current value of our subscription revenue.
- Net revenue is how much we actually brought in for the month.
If you have one off revenue (up-sells, courses, or other products) then the net revenue could often be higher than its recurring counterpart. For ConvertKit the only factor making them materially different is annual plans (paying for a year up front in trade for a discount).
Each November we do a big push for annual plans over Cyber Monday. That will result in net revenue climbing to incredible numbers (this year as high as $3 million!), but because we offer annual plans at a discount, that means a drop in MRR.
The difference can be quite extreme with a big push for annual plans.
Then in future months we already collected some of that revenue, so it still appears in MRR (because an annual plan is recurring), but doesn’t hit the bank account, so it’s not in net revenue. If you remember cash vs. accrual accounting from college, this is a similar concept.
User vs revenue churn
Once you finish with revenue, the next place to look is churn. A common question is “what’s your churn?” The answer is more complex than just a single number. In Baremetrics there are two kinds of churn: revenue and user. One isn’t necessarily more important than the other, but they tell you different things.
Revenue churn is the percentage of your revenue base you lost in a month, whereas user churn is the percentage of customers you lost in a month.
Because our beginner customers churn more often than our larger customers, user churn at ConvertKit is always higher than revenue churn. If you were retaining small customers and losing large customers these would be flipped.
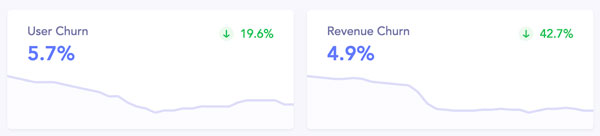
Revenue churn also includes contraction, so it spikes when you do a big push on annual plans, because the discount for moving from monthly to annual decreases MRR. The drop in revenue churn you see above is because the contraction from annual plans is now outside the rolling 30 day window.
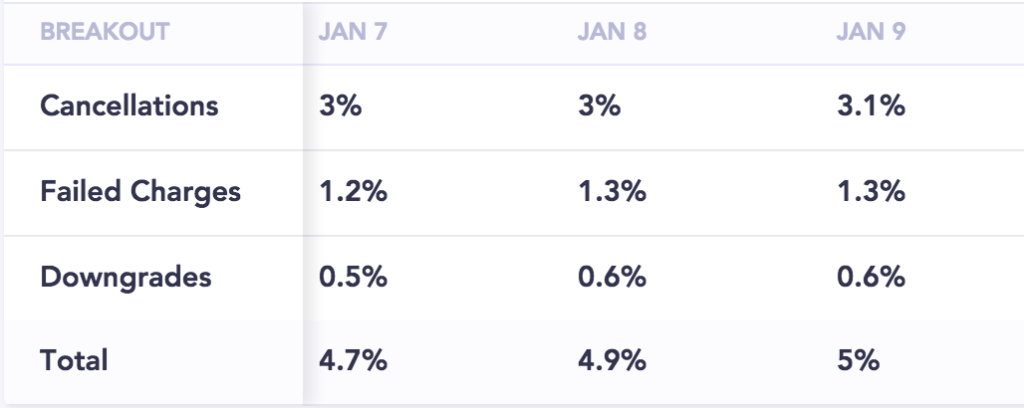
It’s also helpful to see a further breakout in revenue churn between cancelations, downgrades, and failed charges. This shows us that failed charges are decently high and there is some more work we could do there.
Net revenue churn
In the same way MRR is a composite of several metrics, so is net revenue churn. Normally revenue churn is everything that decreases revenue: cancelations and downgrades.
Net revenue churn adds in expansion (i.e. upgrades) to balance out the decrease in revenue. The holy grail in SaaS is to achieve net negative churn, which means that each month your existing customers upgrading adds more revenue than all downgrades and cancelations.
Meaning if you turned off signups and didn’t accept a single new customer, revenue would grow, rather than shrink.
At ConvertKit we are at 2.2% net revenue churn. Our biggest goal this year on the metrics side is to push that down to 0%.
Comparing churn
It’s tempting to compare churn between software companies, which is fine, but you need to know exactly what you are comparing. Enterprise software companies often come up with a unique definition of churn. I remember reading an S1 from a company with net negative churn and realizing that they didn’t consider any account canceling in the first 90 days as churn. That’s convenient, no wonder they had negative net churn!
If you are going to compare, make sure it’s the same number. That’s why it’s helpful to look at the Baremetrics open startups page, since they are all calculated exactly the same way. Though even with the same calculation I would only compare to companies with a similar revenue and industry.
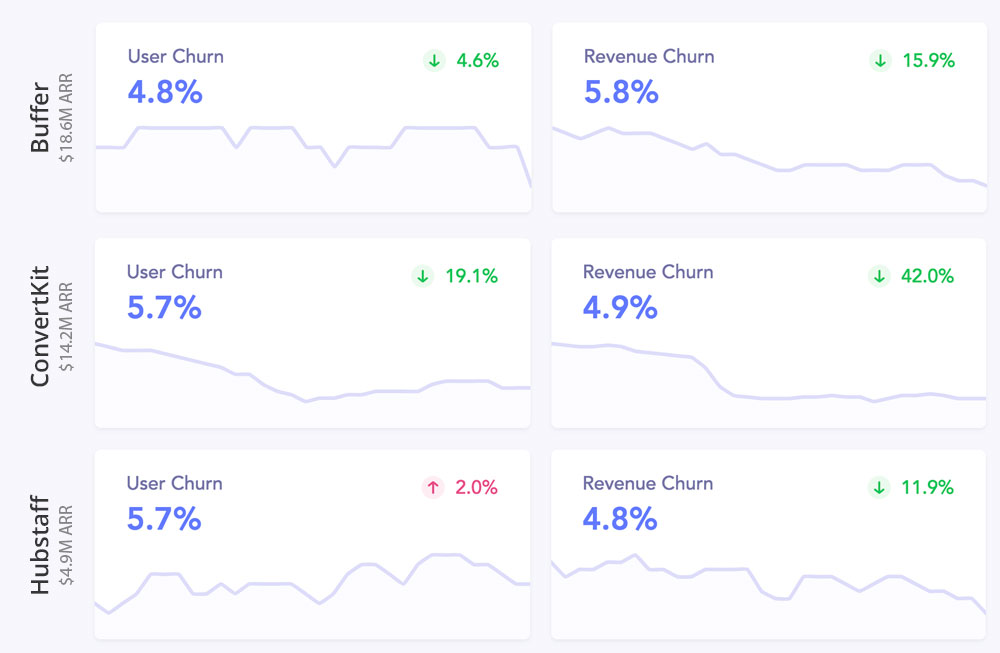
I found it really interesting to compare ConvertKit, Buffer, and Hubstaff (the three largest companies on Open Startups). The churn numbers are very similar! Though Buffer has a higher revenue churn than user churn.
Total customers
The next metric I care about is total customers. Just like with MRR, it’s only so useful to see the number climb up and to the right over time. The real value is in seeing how many net new customers you are adding each month. That’s shown similar to the MRR breakout graph, but simpler since there are fewer inputs.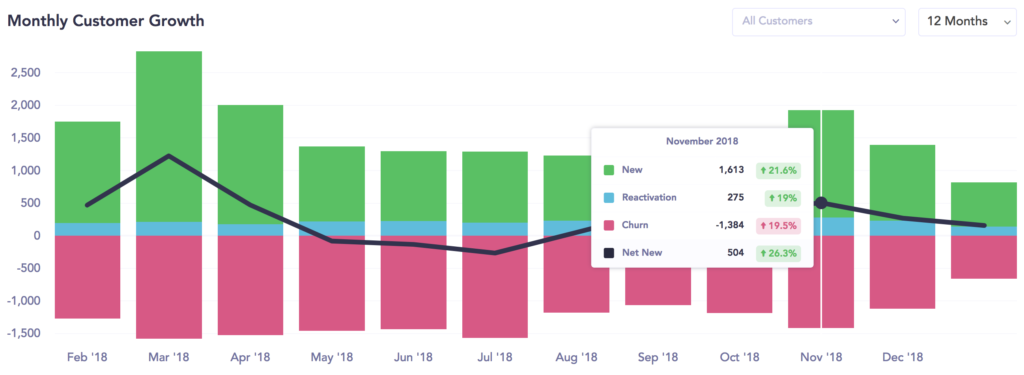
It’s both interesting and depressing to see so many new accounts come in each month and be canceled out by so many customers leaving. It just shows how at a lower price point how much the user churn hurts you. This is where you can really focus on onboarding and activation metrics to make sure these customers are finding value. It’s also where many companies focus on an annual plan to get more of a commitment from these customers.
Quick Ratio
The next thing I look for is the quick ratio, which is a measure of SaaS growth efficiency. The formula for the quick ratio is:
Quick Ratio = (New MRR + Expansion MRR) / (Churned MRR + Contraction MRR)
So the faster you are bringing in new revenue, with low churn, the higher the number will be. Which is obviously great! So the quick ratio shows that uphill battle we are fighting at ConvertKit each month to replace the customers who are leaving.
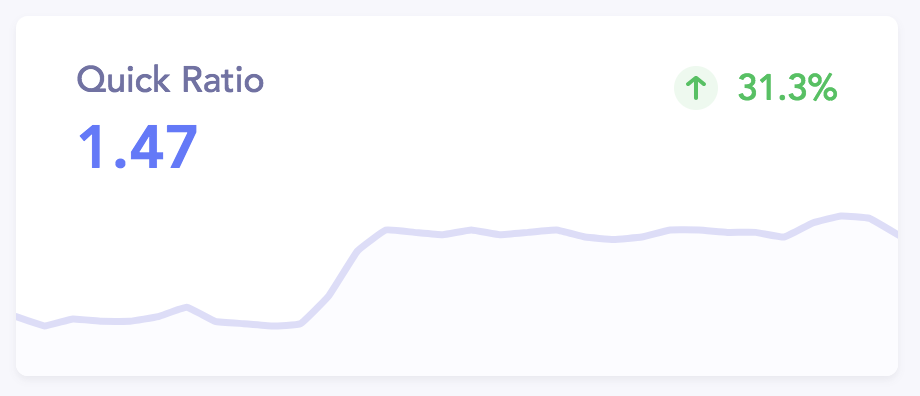
At ConvertKit we have a quick ratio of 1.47, which is fairly low. Though interestingly it’s the highest quick ratio of all the open startups with Buffer at 1.08 and Hubstaff at 1.38. That just shows that all of us suffer from high churn.
Read this article from Tomasz Tunguz on the quick ratio to learn more.
ARPU
Average revenue per user (ARPU) is our next metric. You can multiply total customers and ARPU to get MRR. This is interesting to know how many customers a company has to support in order to make their monthly revenue.
Buffer is at $21 per customer and ConvertKit is at $57 per customer. That means that in order to make the same revenue they have far more customers. This isn’t necessarily good or bad, but it does play into the dynamics of the business.
Personally I’d like to see our ARPU climb to closer to $75-100 (since the larger customers tend to already be successful and have more expansion revenue), but not see it so high that we are beholden to a few customers (if ARPU grew into the thousands of dollars).
We can move this number through attracting customers with more subscribers (who naturally pay more), focus on retaining higher end customers, adding a pro plan, and helping our beginner customers grow their email lists to expand into new plans.
The 80/20 of customers
The last thing I look at is the breakdown of revenue from small customers against everyone else. To do that you move over into the customers tab. First a review of the overall numbers: we have 20,812 generating $1,188,580 in MRR.
Knowing that we have a lot of customers on the base plan ($29 for 1,000 subscribers), I can do a search for everyone who pays more than $29/month.
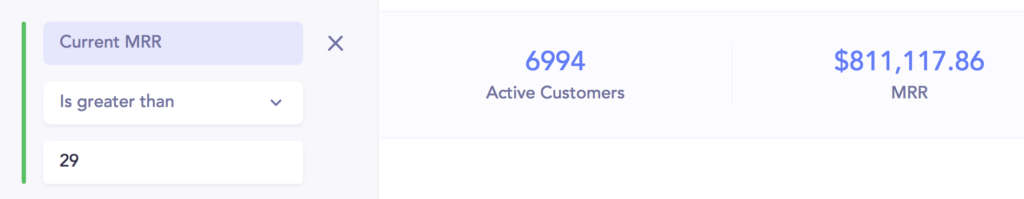
That is 6,994 customers (33% of the total) generating $811,117 in MRR (68% of the total). Or put another way, 67% of our customers are generating only 32% of our revenue. This is because we have customers paying everything from $29 up to $5,000 to use ConvertKit.
***
Now head on over to ConvertKit’s Baremetrics page and look beyond just MRR to understand more behind the business. Then compare those numbers to other open startups to uncover trends. Drop a comment with any observations!


I’d be curious what ratio of your churned recurring revenue is lower tier customers vs. higher tier customers.
I’d imagine you’d have a lot less churn / a lot higher overall lifetime value on your higher end customers that probably leave to competitors vs. lower tiers that leave because they don’t use email anymore.